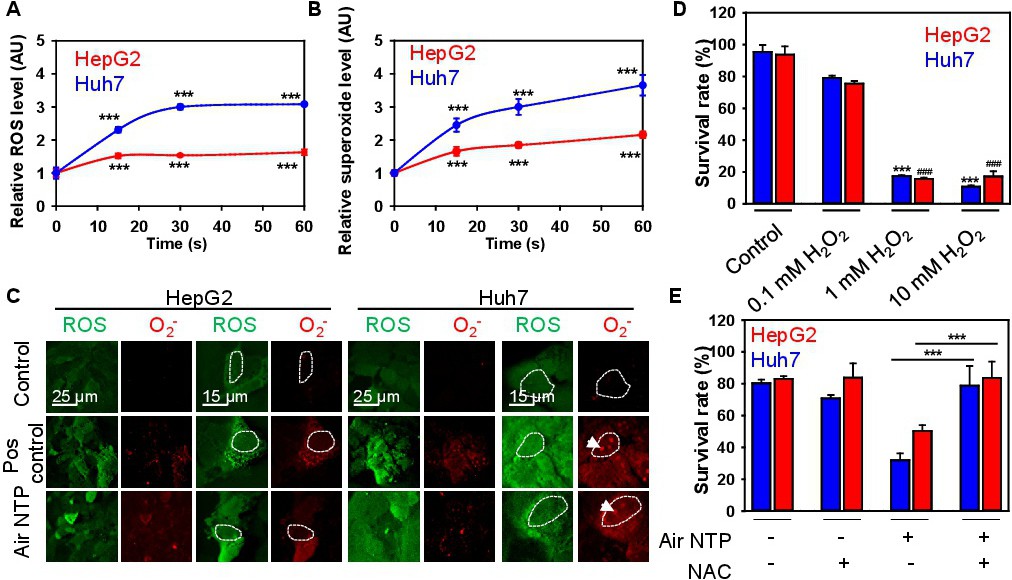
Fig. 3. NTP induces excessive ROS accumulation in HCC cell lines. (A) Dose-dependent (6 hours after NTP exposition) ROS/RNS induction by NTP. Huh7 and HepG2 cells were exposed to NTP, followed by ROS measuring, using the cellular ROS/RNS detection kit (Abcam) by spectrofluorometry. Readings were done in quadruplicates, data are present as mean ± SEM, n = 3 (three independent experiments). One-way ANOVA with Newman-Keuls multiple comparison test was used; t = 0 time point serving as control, ***P< 0.001. (B) Dose-dependent (6 hours after NTP exposition) Superoxide (O2-) induction by NTP. Huh7 and HepG2 cells were exposed to NTP, followed by superoxide measuring, using the cellular ROS/Superoxide Detection Assay Kit (Abcam) by spectrofluorometry. Readings were done in quadruplicates, data are present as mean ± SEM, n = 3 (three independent experiments). One-way ANOVA with Newman-Keuls multiple comparison test was used; t = 0 time point serving as control, ***P< 0.001. (C) NTP treatment induced intracellular ROS / Superoxide (O2-) production and different subcellular accumulation. Plasma-treated cells were stained with ROS/Superoxide Detection Assay Kit and imaged by confocal microscopy. Representative images out of three independent experiments are shown. Positive control 500 µM H2O2 for 1 h was used. Circles indicate nucleus borders. Arrows show nuclear localization of superoxide. (D) Effects of H2O2 on cell viability were detected by WST-1 assay. Cells were incubated with different concentrations of H2O2 for 24 h and then the viability was assessed as in (A). Data are present as mean ± SEM, n=3 (three independent experiments). One-way ANOVA with Newman-Keuls multiple comparison test was used; ###P< 0.001, ***P< 0.001. (E) ROS scavenger prevents the cytotoxicity induced by NTP. Treatment with ROS scavenging agent N-acetyl-L-cysteine (NAC) completely abolished the cytotoxicity of NTP. Viability of Huh7 and HepG2 cells exposed to the NTP for 60 s with supplementation of 5 mM NAC was detected by WST-1 assay 24 h post plasma treatment. The data were normalized to control values (no exposure), which were set as 100 % cell viability. Readings were done in quadruplicates, data are present as mean ± SEM, n=3 (three independent experiments). One-way ANOVA with Newman-Keuls multiple comparison test was used; ***P< 0.001.